
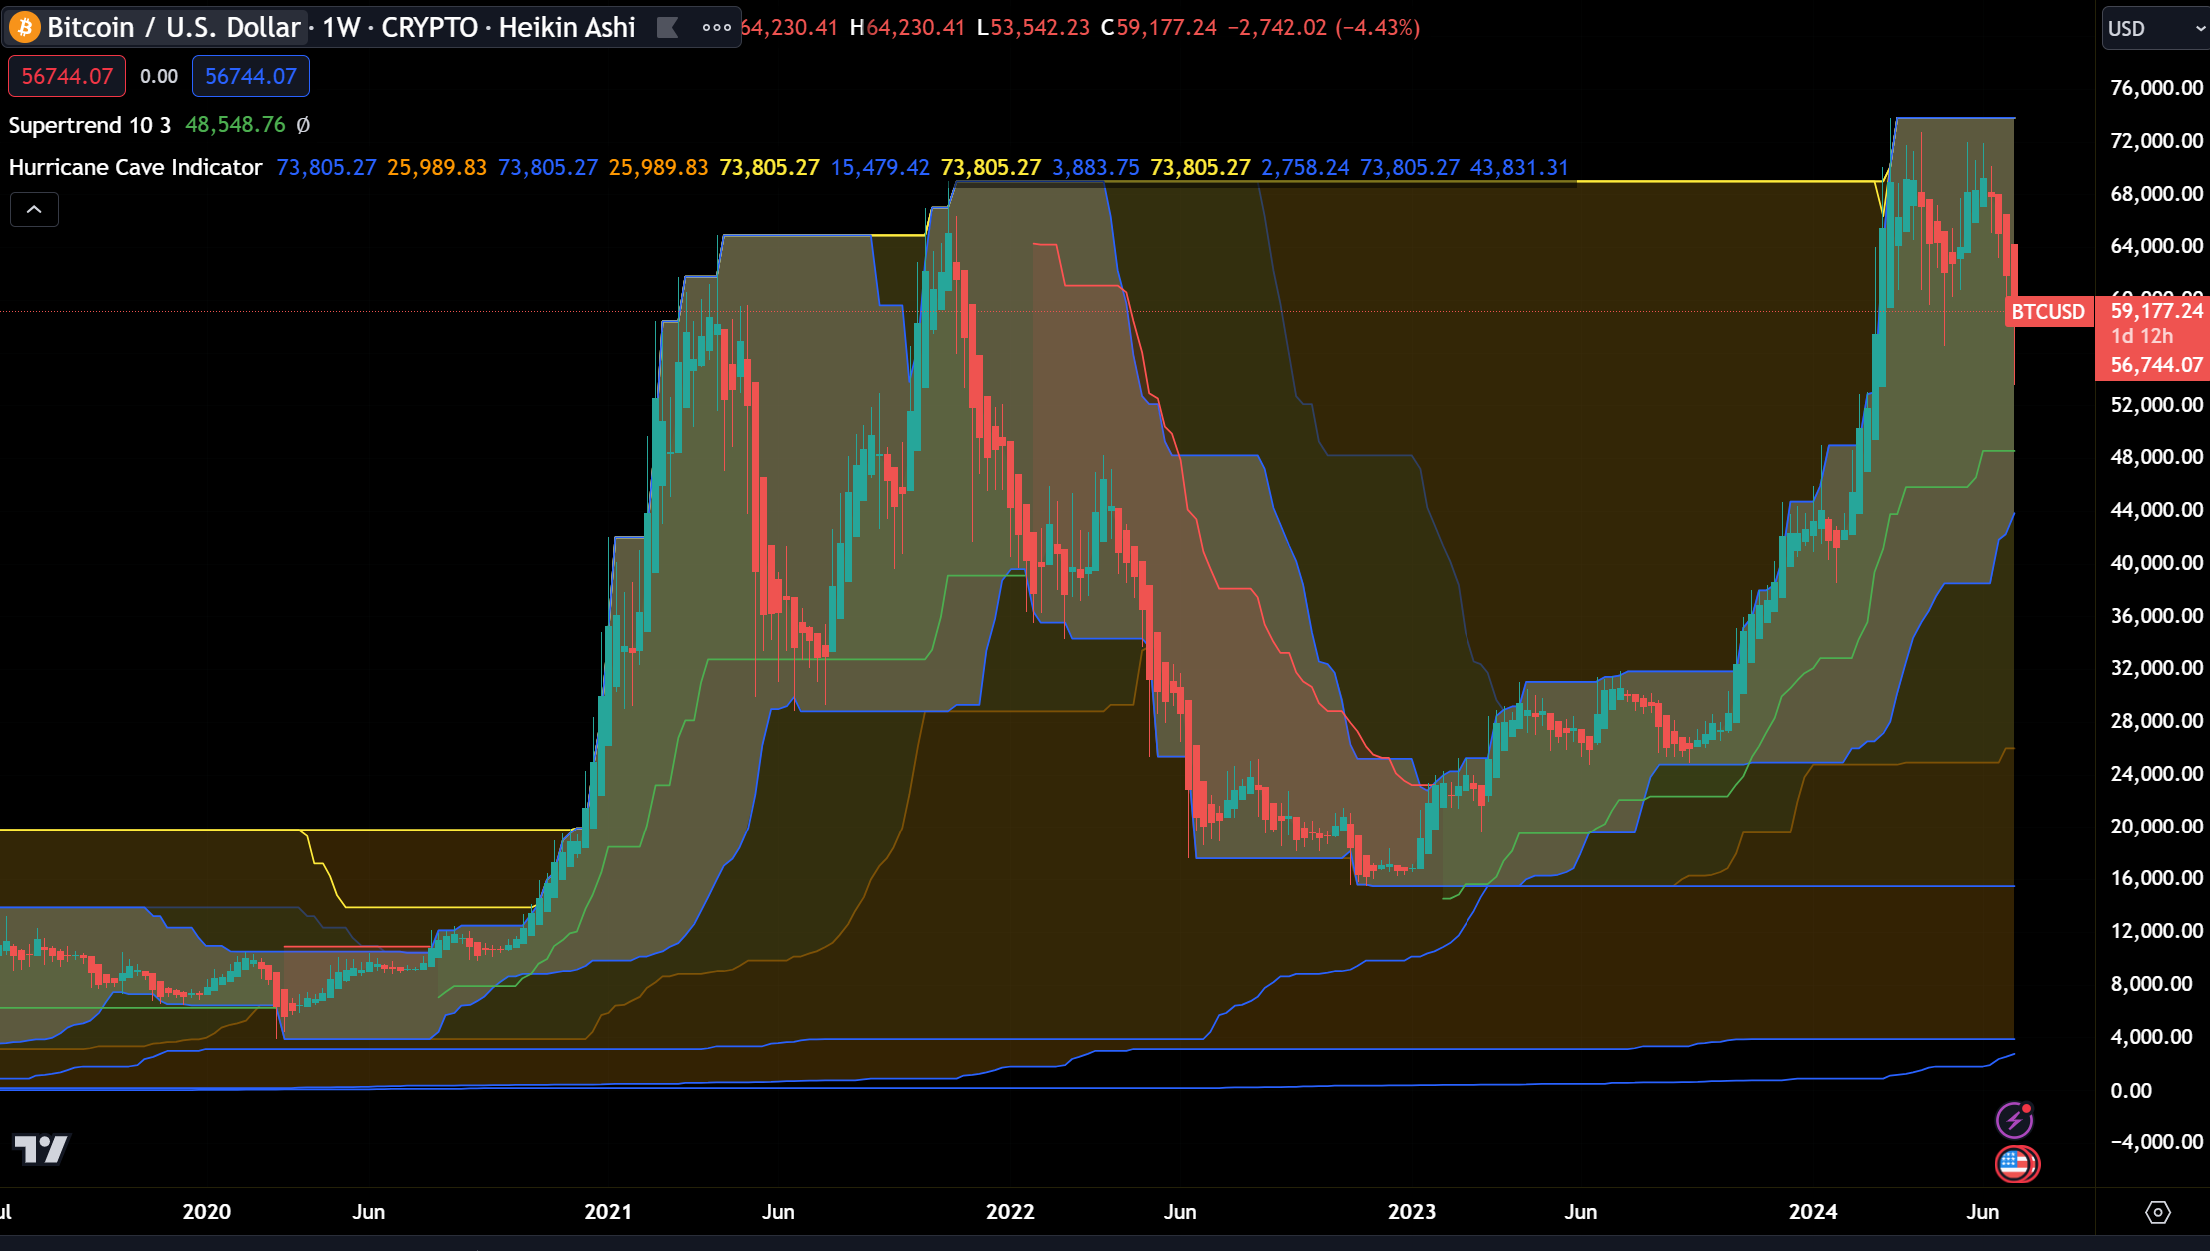
In the tumultuous landscape of cryptocurrency, Bitcoin has consistently captured headlines with its dramatic price movements. As we delve into the patterns of the last ten years, the looming question arises: could Bitcoin’s price slide to $42,500 against the dollar? This post will explore historical data, market trends, and economic factors that may steer Bitcoin towards this specific price point.
Decade-Long Overview of Bitcoin’s Price
Over the last decade, Bitcoin has experienced meteoric rises followed by sharp declines—a cyclical pattern that leaves investors on a perpetual rollercoaster. From its humble beginnings to its peak near $64,000 in April 2021, Bitcoin has shown resilience amidst volatility. However, the journey has not been without its downturns, with significant corrections often following record-breaking highs.
Factors Influencing Bitcoin’s Price
- Market Sentiment: The Fear & Greed Index and various news cycles have historically influenced speculative trading that drives up price volatility.
- Regulatory News: Announcements from governments and financial institutions can either validate Bitcoin’s utility or incite fear, impacting its price drastically.
- Technological Advances: Innovations and enhancements within the blockchain ecosystem, such as the adoption of the Lightning Network, tend to promote bullish behavior among investors.
- Economic Indicators: Global economic stability, inflation rates, and the strength of fiat currencies like the US Dollar, also play crucial roles in Bitcoin’s valuation.
Predictive Analysis: Could Bitcoin Hit $42,500?
Using historical pricing data and predictive algorithms, financial analysts observe that periods of high upward trajectories are often followed by corrections. If we apply this pattern analysis to our current context in 2024, where Bitcoin has rebounded from several dips yet still faces global economic uncertainties and aggressive regulatory stances from major economies, a drop to $42,500 could be within view.
Technical Indicators and Historical Cycles
Charting the Bollinger Bands and Moving Average Convergence Divergence (MACD) can offer insights into potential future movements. Currently, the widening of Bollinger Bands suggest increased volatility, while a bearish crossover in MACD might indicate a potential sell-off, adding credence to the $42,500 target theory.
Investor Sentiment and Market Dynamics
Community sentiment, often reflected through social media platforms and crypto forums, shows a mix of caution and optimism. The introduction of new institutional investors and advancements in crypto technologies could balance market sentiment, potentially cushioning any drastic falls.
Conclusion
Predicting Bitcoin’s price with certainty remains a complex endeavor, heavily influenced by a blend of behavioral economics and market speculations. While the possibility of Bitcoin reaching $42,500 is backed by historical trends and current analyses, investors should approach with caution, equipped with thorough research and risk management strategies.
As the market continues to evolve, staying informed and adaptable will be crucial for those navigating the volatile waters of Bitcoin investment. Remember, in the world of cryptocurrency, change is the only constant.




Be First to Comment